Metrics Monitoring for your Spark Cluster!
- 8 mins
What is Graphite
Graphite is a piece of software that allows for the monitoring of time-series metrics. From their website:
Teams use Graphite to track the performance of their websites, applications, business services, and networked servers. It marked the start of a new generation of monitoring tools, making it easier than ever to store, retrieve, share, and visualize time-series data.
Graphite does not actually collect, so to say, the metrics or the data from a machine, it only provides a web-server that listens for data, stores that data in a database, and allows you to graph that data on their (ugly) front end. Here is what graphite looks like when it is running on your server… 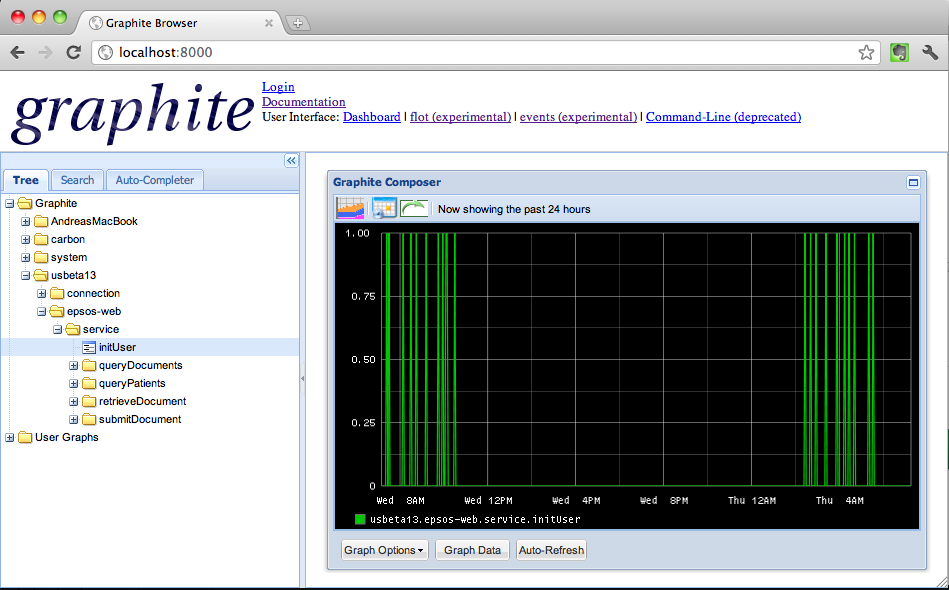 A couple things to note…
- The URL (should be) is a AWS URL (Hint, hint, I will be setting up the graphite webserver on a Ubuntu 14.04 LTS version EC2 Machine.
- The UI is terrible, I know, thats why we will use grafana
- The Metrics on the left panel displays directories for where our data is comming from.
- Notice How the directories are indented so
Metrics/spark/master/1ip-10-0-0-244_ec2_internalrepresents the metrics we are getting from our master node with internal IP of 10.0.0.244 from our cluster. - Once everything is setup, you simply click on the subdirectories and then on the specific folder metrics, such as
cpu-0and thencpu-idleto see the metrics graphed on the panel. - Note, I had to use an alternative screenshot of graphite web so you won’t see my aws url or the nested directory structure I mentioned above
- Notice How the directories are indented so
So how do we collect the system metrics?
Collectd - The System Statistics Collection Daemon
Collectd is a dameon (piece of software) that once we install on a machine, collects data from that machine on all sort of different metrics (cpu usage, memory usage, network flow, disk reads/writes, etc) and writes it to an external time-series database (i.e. grafana)
Where do I start doing all of this?!?
Start Here if all the above jargon is confusing you. The first thing you need to do is start a EC2 instance that will be used to store the metrics and run the webserver.
- Go to AWS EC2 and launch a 14.04 Ubuntu LTS EC2 instance
-
sshinto the server - Now we can begin by installing graphite
Graphite Installation
Once you are sshed into your Ubuntu, install with this link. Go to the section that says Installing on an Existing 14.04 Ubuntu LTS Host
> wget https://github.com/obfuscurity/synthesize/archive/master.zip
> unzip master.zip
> cd synthesize-master/
> sudo ./install
Once this is installed, you should see the graphite UI when you navigate to the AWS URL in your EC2 console. If it does not work, prepend the link with http:// or https://
Grafana Instalation
Next, we want to install Grafana. Grafana is the front end that we will use as suppose to Graphite’s web UI (see picture at the very top). It will run on the same Ubuntu 14.04 machine that graphite is on but will be accessible via http:// prepended to the url and and on PORT :3000
I followed the directions on this link from grafana’s website which was extremely straight forward and easy for me. I don’t remember if I ran all the scripts on that page, but try to run
> sudo yum install grafana
to see if everything works fine. The grafana guide uses apt-get, but since we are not using debian, we can use yum instead, which works just fine).
Start Grafana by running
> sudo service grafana-server start
You can restart by replacing start above with restart and similarly stop with stop.
The grafana frontend should now be running on PORT 3000
Navigate to http://ec2-123-45-67.compute-1.amazoneaws.com:/3000 (or whatever your ec2 public url is) to see that it is working. Yay!
Now that everything is up and running, we will need to actually send metrics to this server. That’s where collectd comes in.
Collectd Installation
You will now need to ssh into one of the nodes of your spark cluster so that we can install collectd.
> ssh spark_m1
and then install collectd…
> sudo yum install collectd
We now need to find the collectd.config file so that we can edit it and make it write to our graphite server.
To find this file, navigate (use less) to the following directory
[cloudbreak@ip-10-0-0-244 ~]> less /etc/init.d/collectd
This is the script that is run everytime your Ubuntu machine starts. At the top of the file, we can see where it looks for the config file We are interested in the first config:
/etc/collectd.conf
Use nano or vim to edit this file:
> nano /etc/collectd/conf
This file is already pre-built/populated and we only need to minimally change it. Scroll down to the part where we see plugins and remove the # from #LoadPlugin write_graphite. To enable collectd to write metrics to the graphite server. Scroll again to the bottom where you see the plugin configurations (which is commented out currently) for the plugin.
For host in the plugin configs, you should but the IP Address for your graphite host server and you can edit Prefix and place . to indicate the directory sub structure you want graphite to store your data. I made my prefix like this:
spark.master.1.hostname
And we’re done! Launch collectd by running
> sudo service collectd start
And you should have your first node sending metrics! Horray! Adding the other machines is as easy as reinstalling collectd on each machine and editing the config file like above.
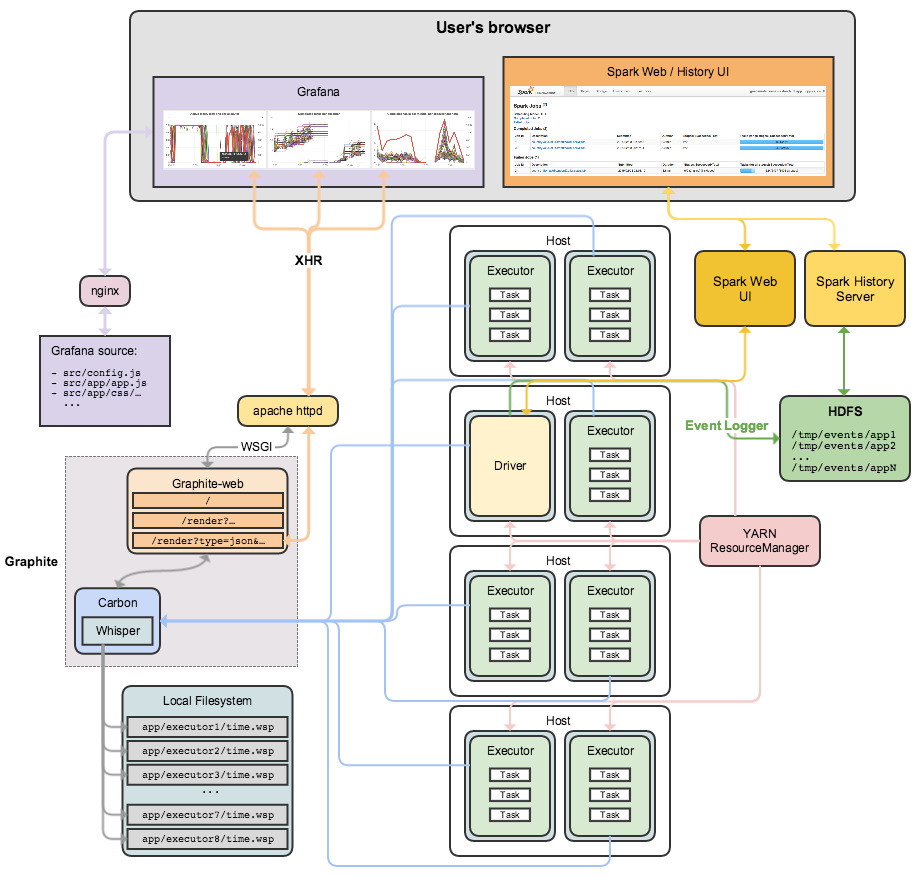
System Architecture
Troubleshooting
You may get an error when trying to start collectd saying that it cannot read the configuration file. If this happens, it is likely that you tried to enable a plugin that may not have been built yet. Comment out the most recent plugin that you enable in the collectd.config file and start collectd again (sudo service collectd start).
Getting Spark Application Metrics into Graphite
Getting Spark to send its own application metrics to your graphite server is arguably a much easier process. Spark has a built in file that you must again simply edit to have spark send metrics to your graphite server. In this great post by hammerlab, you can follow directions to enable spark metrics. I however, was able to edit my metrics file directly on Ambari (on my Hortonworks distribution).
- Visit Ambari on your master node (it should live on PORT:
8080 - Navigate to the Spark menu on the left hand drawer.
- Click on the config tab on the top
- Click on Advanced spark2-metrics-properties
- Append to the file to have the metrics sent to graphite as such…
# Enable Graphite
*.sink.graphite.class=org.apache.spark.metrics.sink.GraphiteSink
*.sink.graphite.host=<graphite host>
*.sink.graphite.port=<graphite port>
*.sink.graphite.period=10
# Enable jvm source for instance master, worker, driver and executor
master.source.jvm.class=org.apache.spark.metrics.source.JvmSource
worker.source.jvm.class=org.apache.spark.metrics.source.JvmSource
driver.source.jvm.class=org.apache.spark.metrics.source.JvmSource
executor.source.jvm.class=org.apache.spark.metrics.source.JvmSource
- Note: you need to change the host to match your own graphite host.
- Feel free to comment in/out the last 4 lines to enable/disable any metrics that you do/do not want.
Thats it!
Hope everything worked out smoothly for you during your configuration. If there was any problems, feel free to leave a comment and I will try to help out as best as I can.
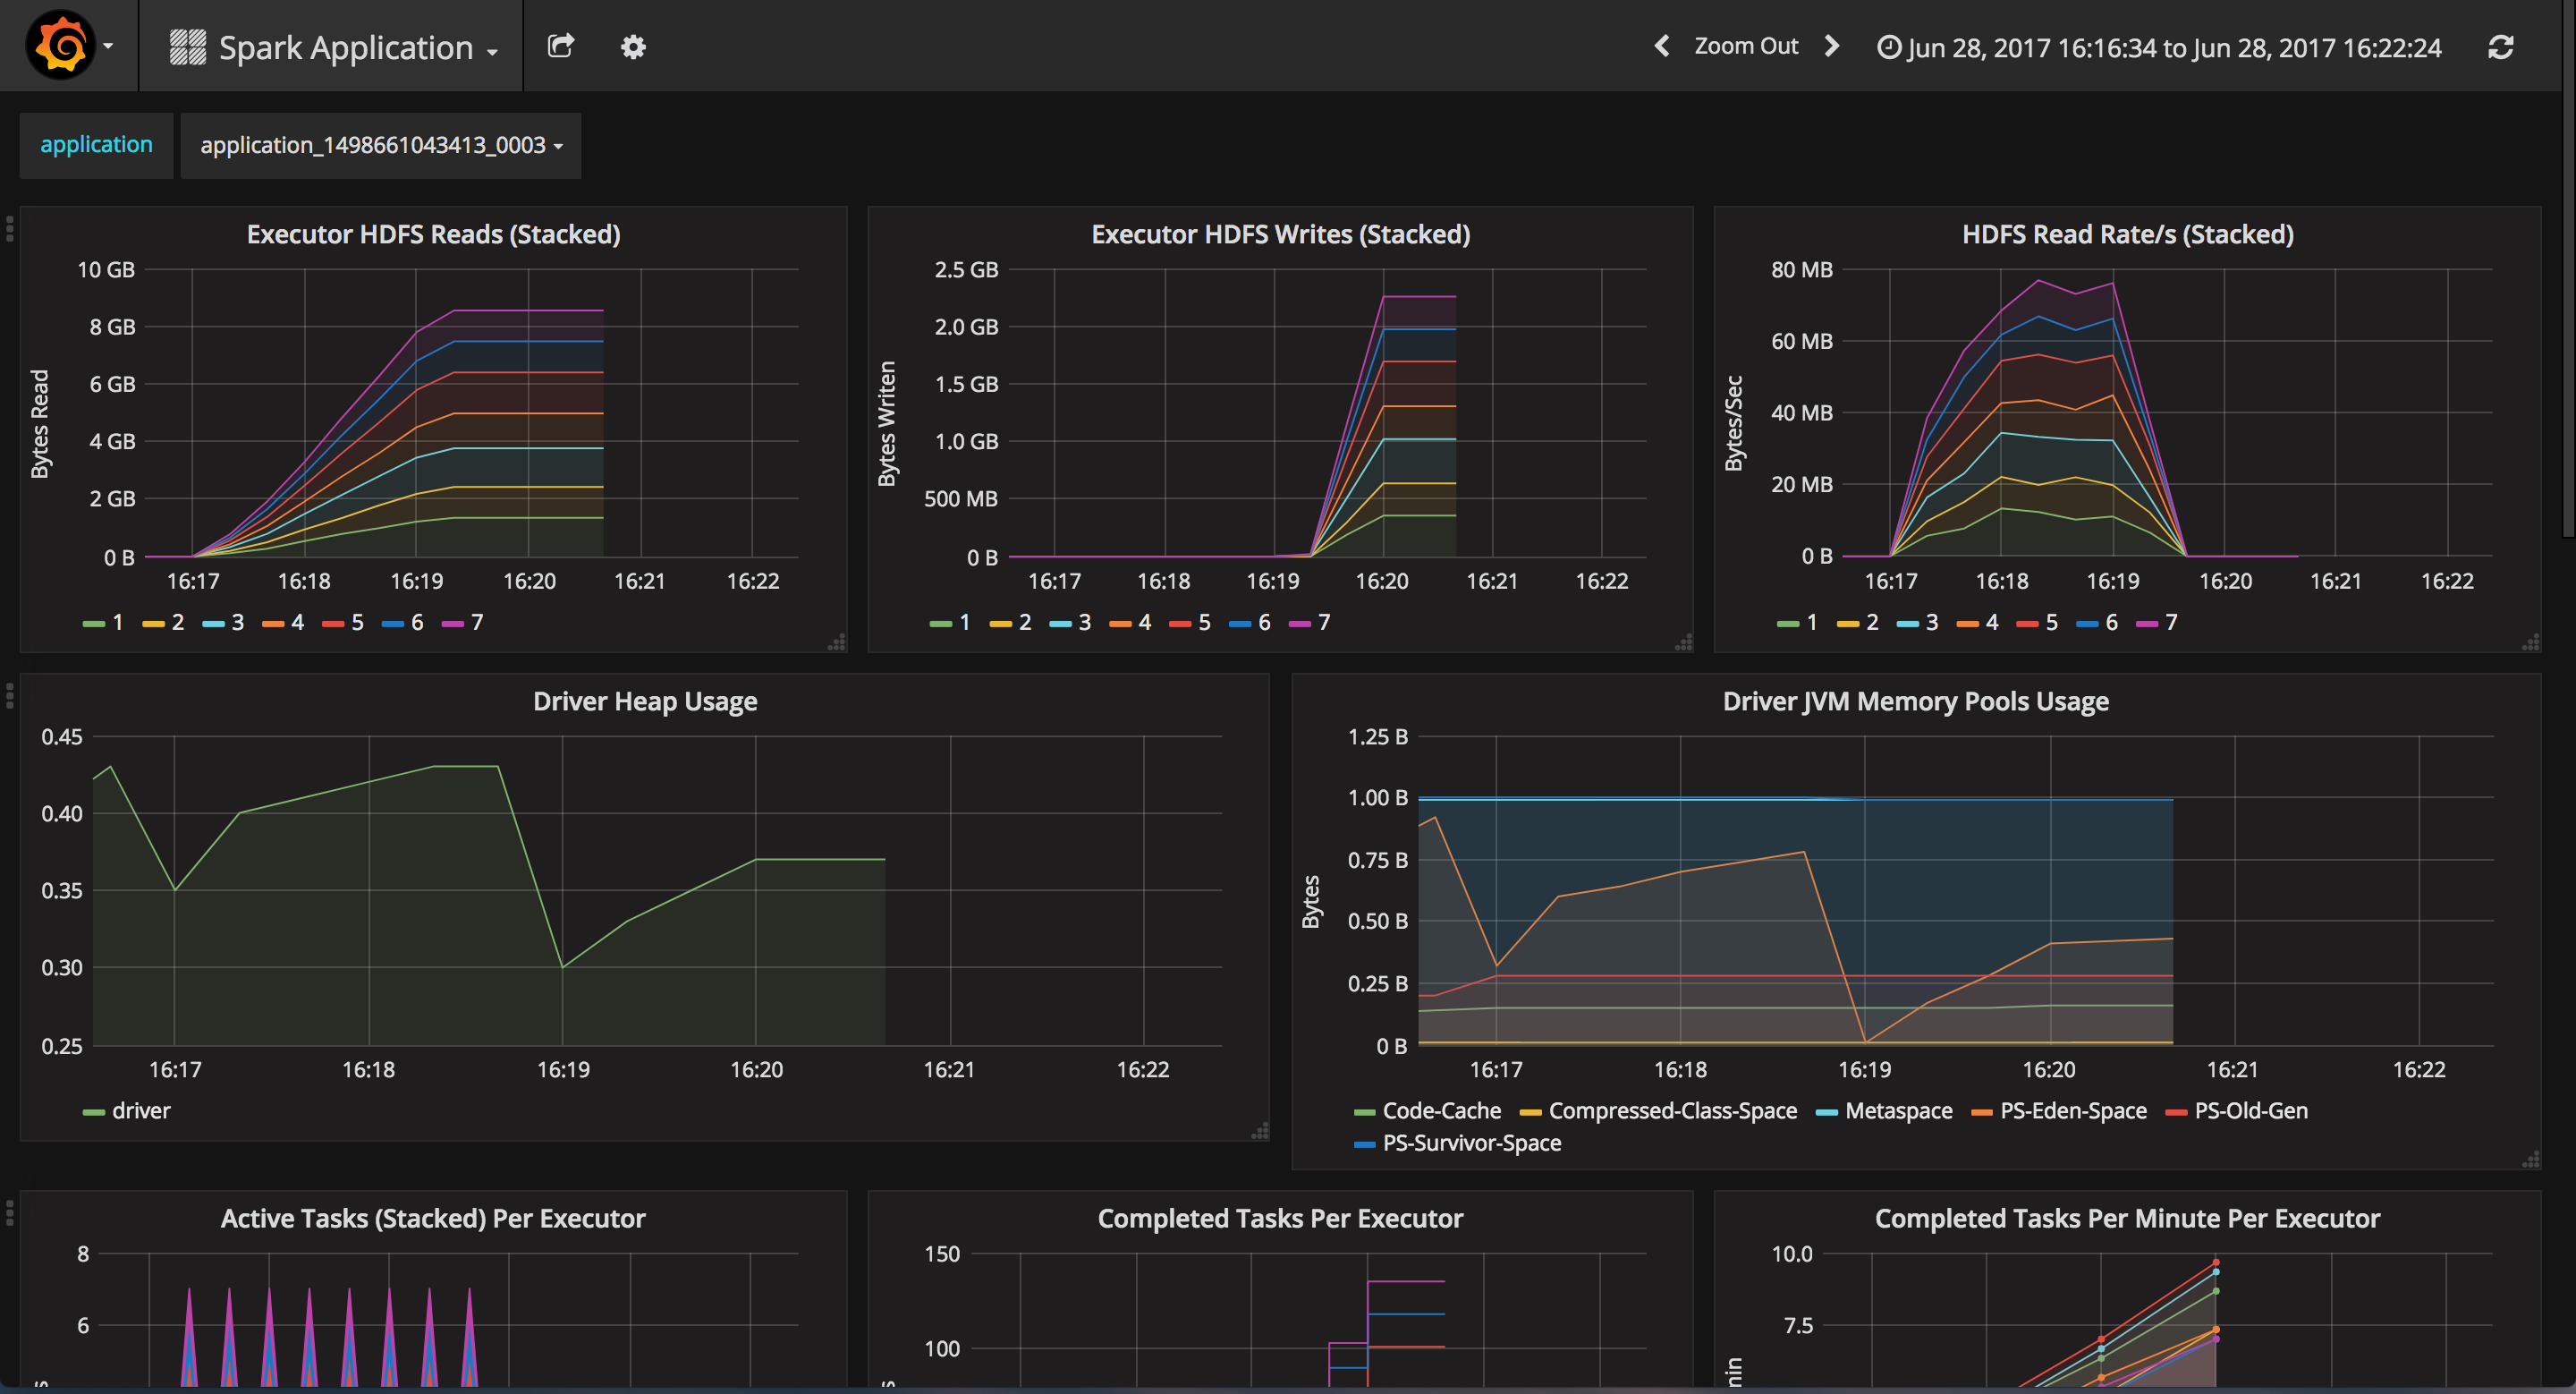
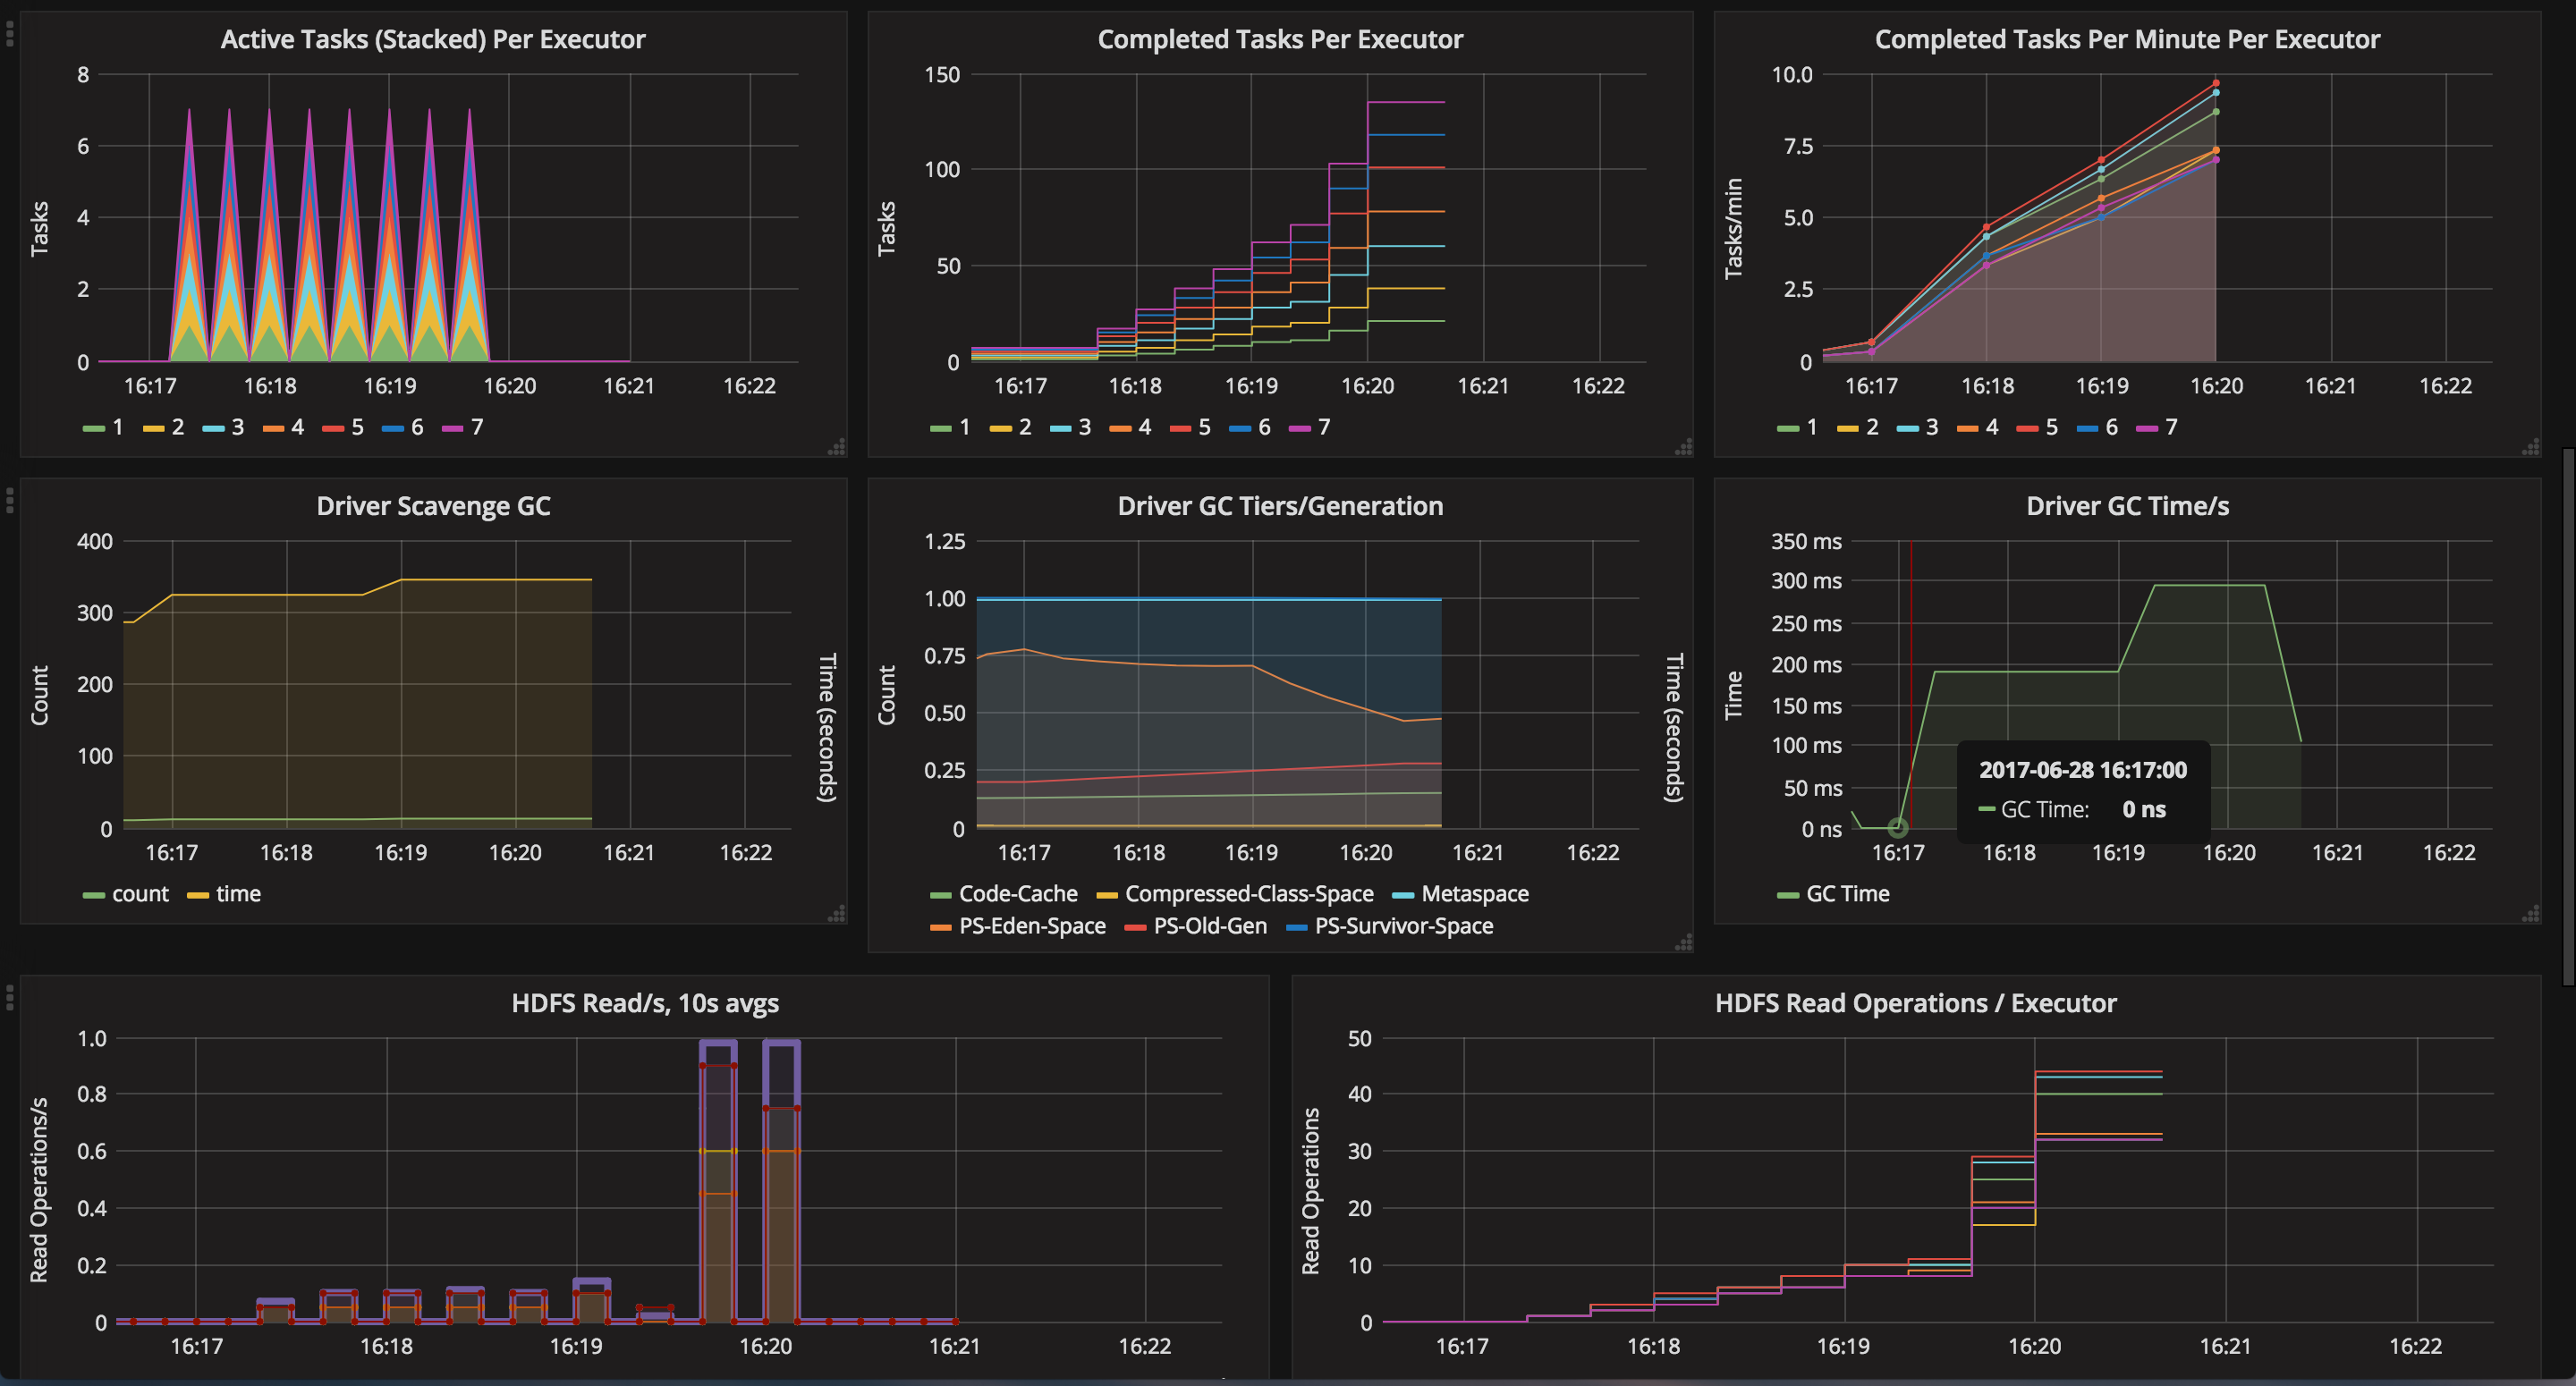
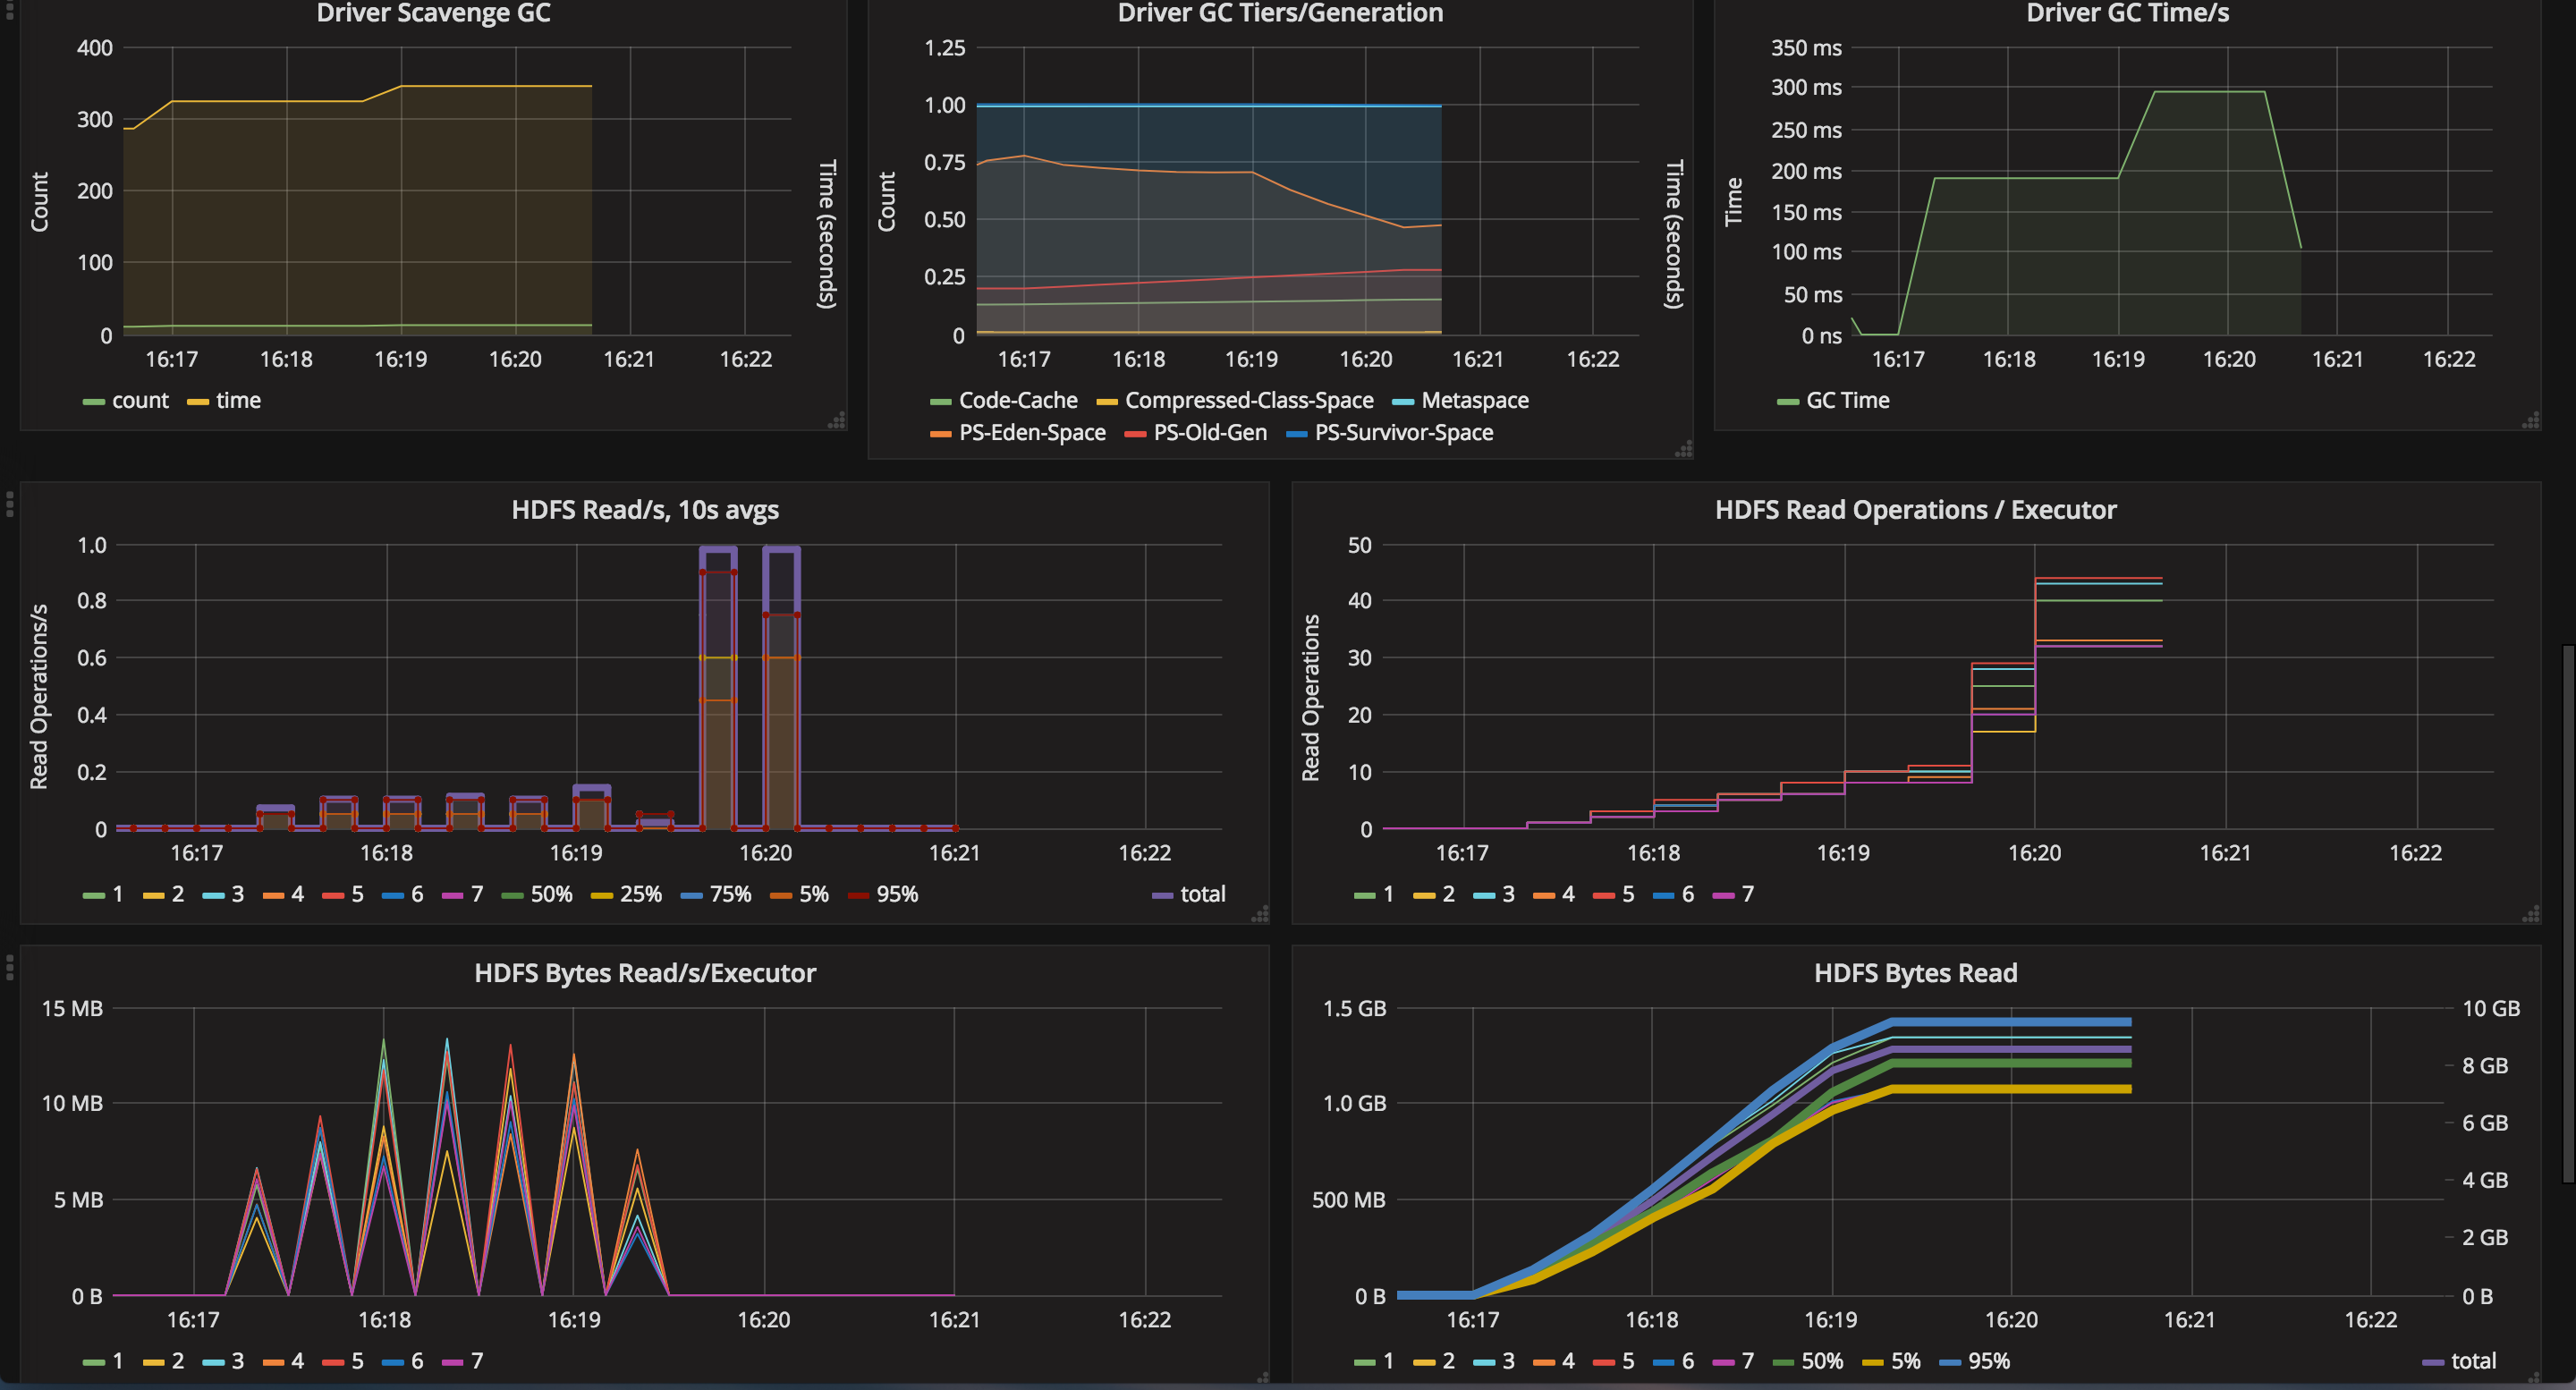
Here is a snapshot of one such visualization that I made with graphana. I simply ran a word count on a 8 gigabyte csv file and let it run on 2 or 3 worker nodes (with 7 executors). Here is a screenshot from that link, in case it expires…

Yusuf Ameri
Learning Since 1997